
InfoEdit
Probing Global Layout Reasoning in Infographic Editing
tl;dr
InfoEdit is the first benchmark for infographic editing, and it targets the capability existing benchmarks rarely measure: reflow. We evaluate both pathways: pixel-level image editors, and code-level editing over the HTML/PowerPoint source. Neither works well. The best pixel-level editor reaches 62.0% average success rate and the best code-level system (Kimi-K3) 67.9%, while most pixel-level editors fall below 7%.
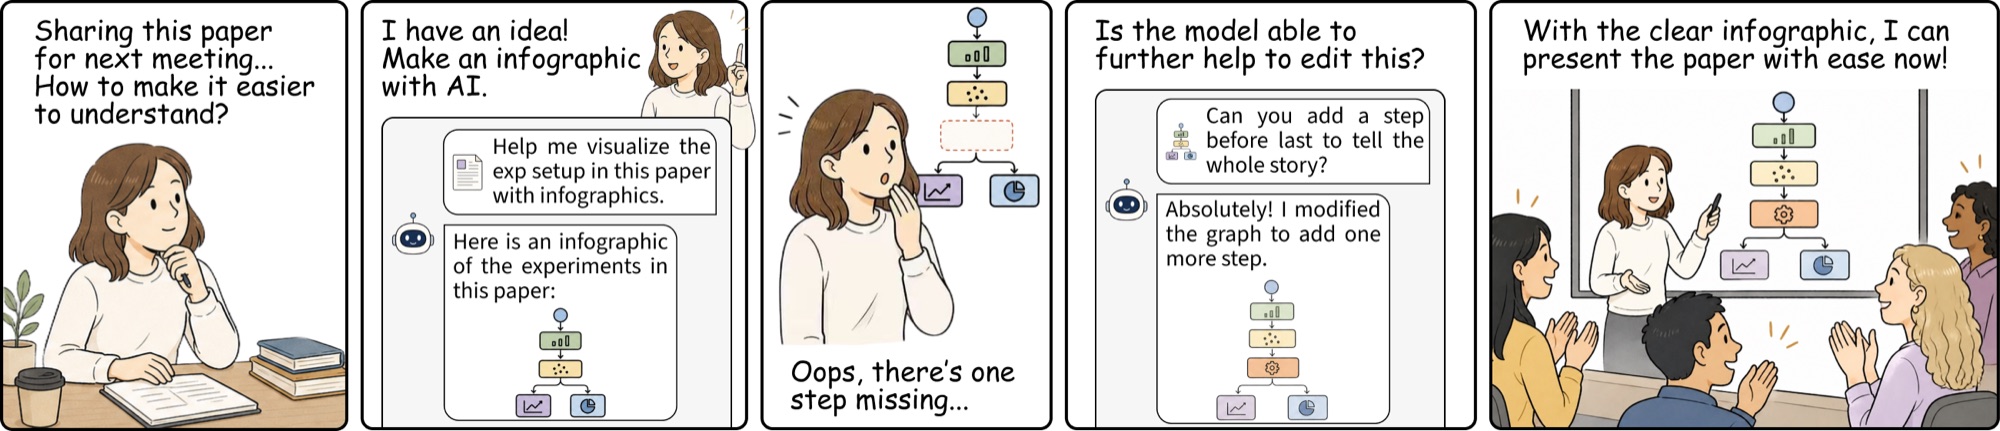
What InfoEdit measures
Given an original infographic X and an instruction I that names a structural change, an editor must produce X′ that satisfies two predicates at once: the named change is faithfully executed, and every element the instruction did not mention survives — free to reflow to accommodate the change.
CEdit Compliance
The change named by the instruction is executed on its target: the right element, at the right anchor, with its content fully rendered inside the canvas.
PContent Preservation
Every other element of the source survives intact. Repositioning, resizing, re-wrapping and connector rerouting are allowed — that is reflow, not failure.
SRSuccess Rate
An edit counts as a success only when both predicates hold. The decomposition exposes correct edits that silently damage unmentioned neighbors.
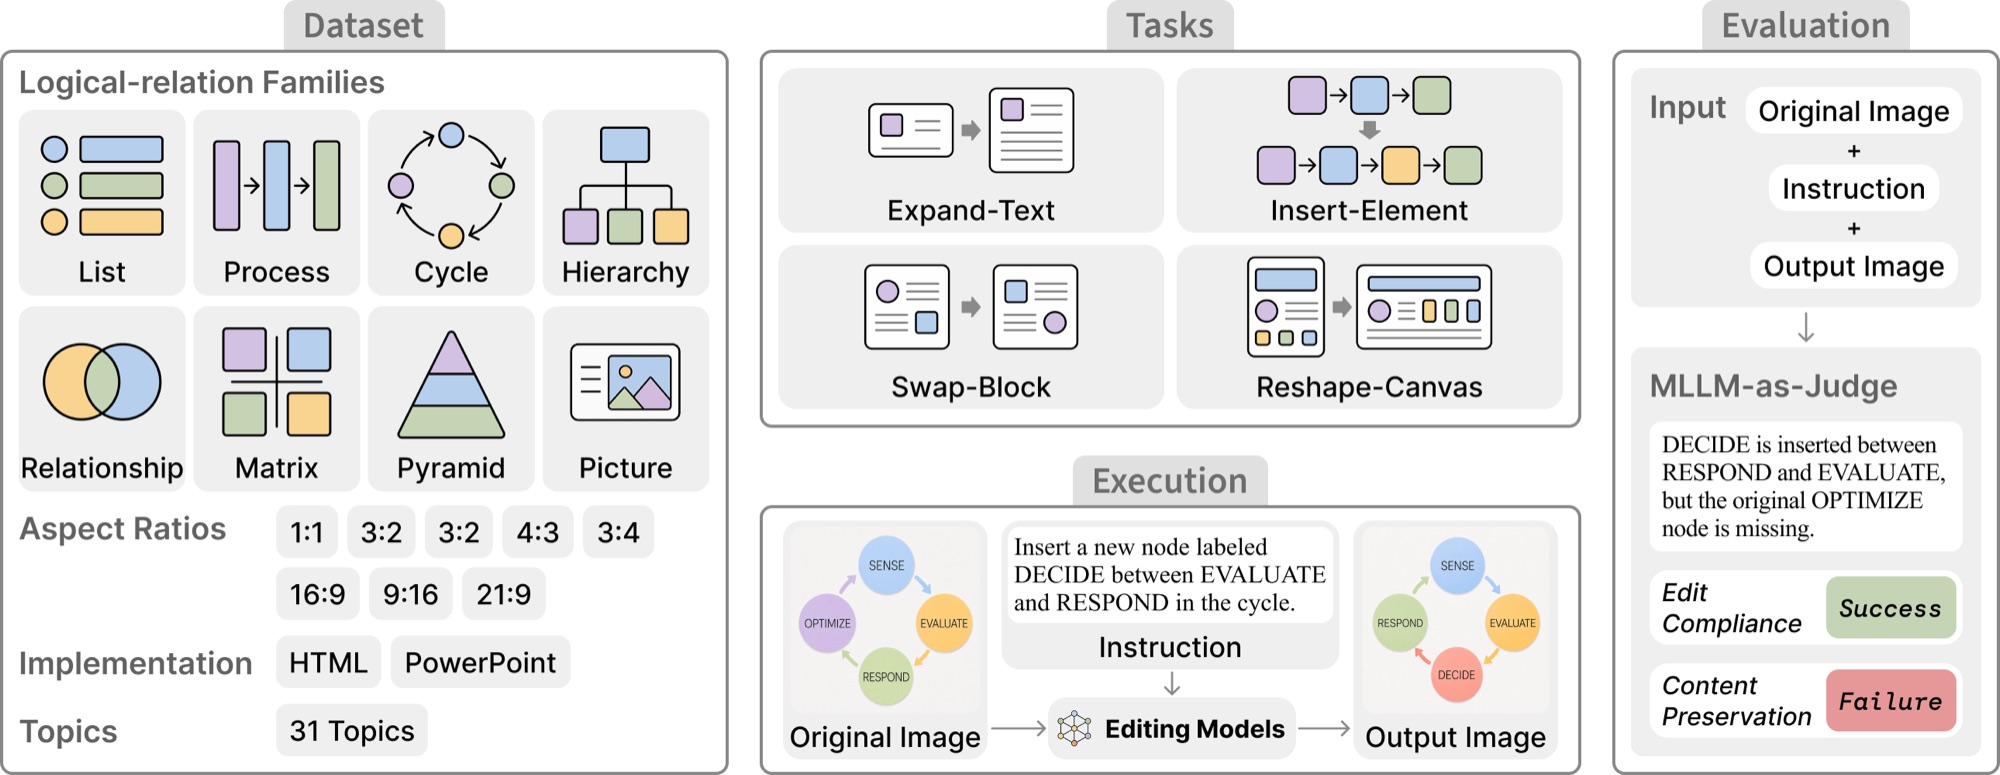
1,000 infographics, eight logical relations
Every infographic is topically realistic, aesthetically credible, and — crucially — logically structured: it conveys information through visual logical-relation components. Each family imposes its own reflow contract that any valid edit must satisfy. Each infographic ships with an editable, structurally addressable source file: 800 in HTML/CSS and 200 in PowerPoint.
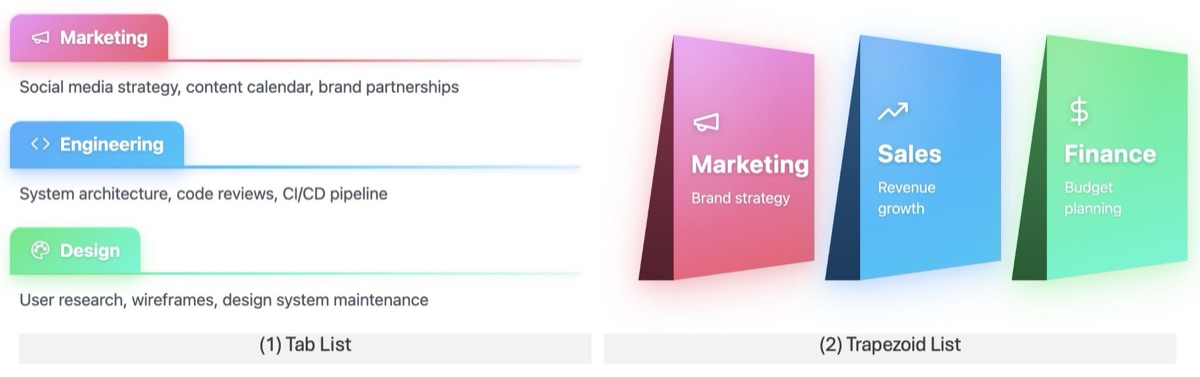
List
Family annotations are not mutually exclusive: 81% of infographics compose two to six families on one canvas, so the shares above sum to more than 100%.
Four tasks, increasing perturbation scope
From a text-level change to a canvas-level restructuring: Expand-Text, Insert-Element, Swap-Block and Reshape-Canvas. For each of the 1,000 infographics, annotators write one instruction per task — 4,000 pairs in total — and every instruction is verified to be feasible and reflow-inducing. Each example shows the source infographic, its instruction, and the expected versus an unexpected edited result; click any panel to open it full size.
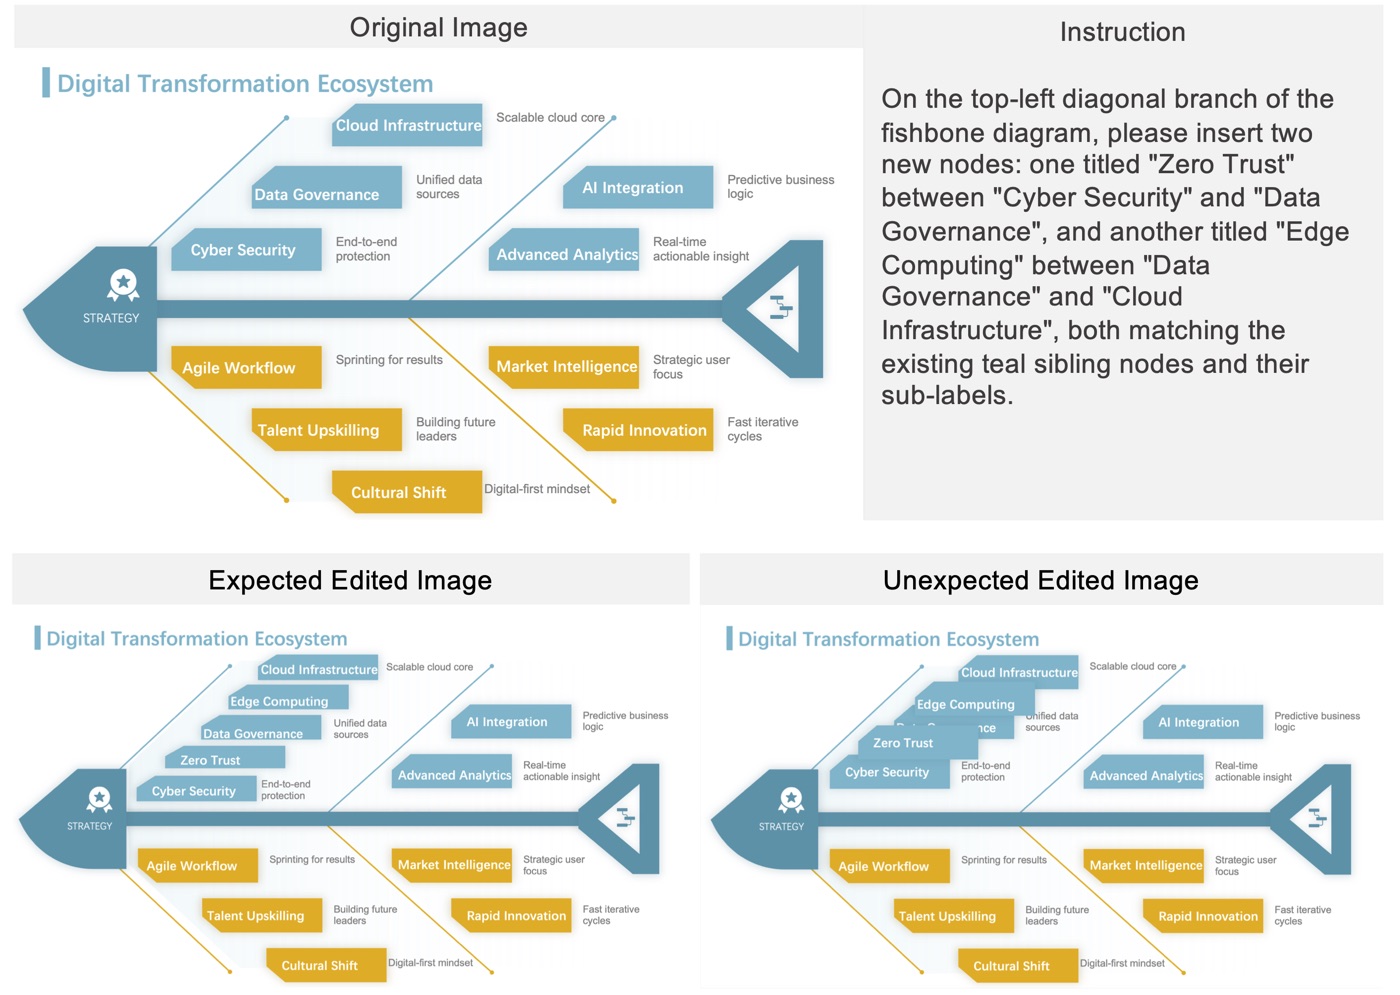
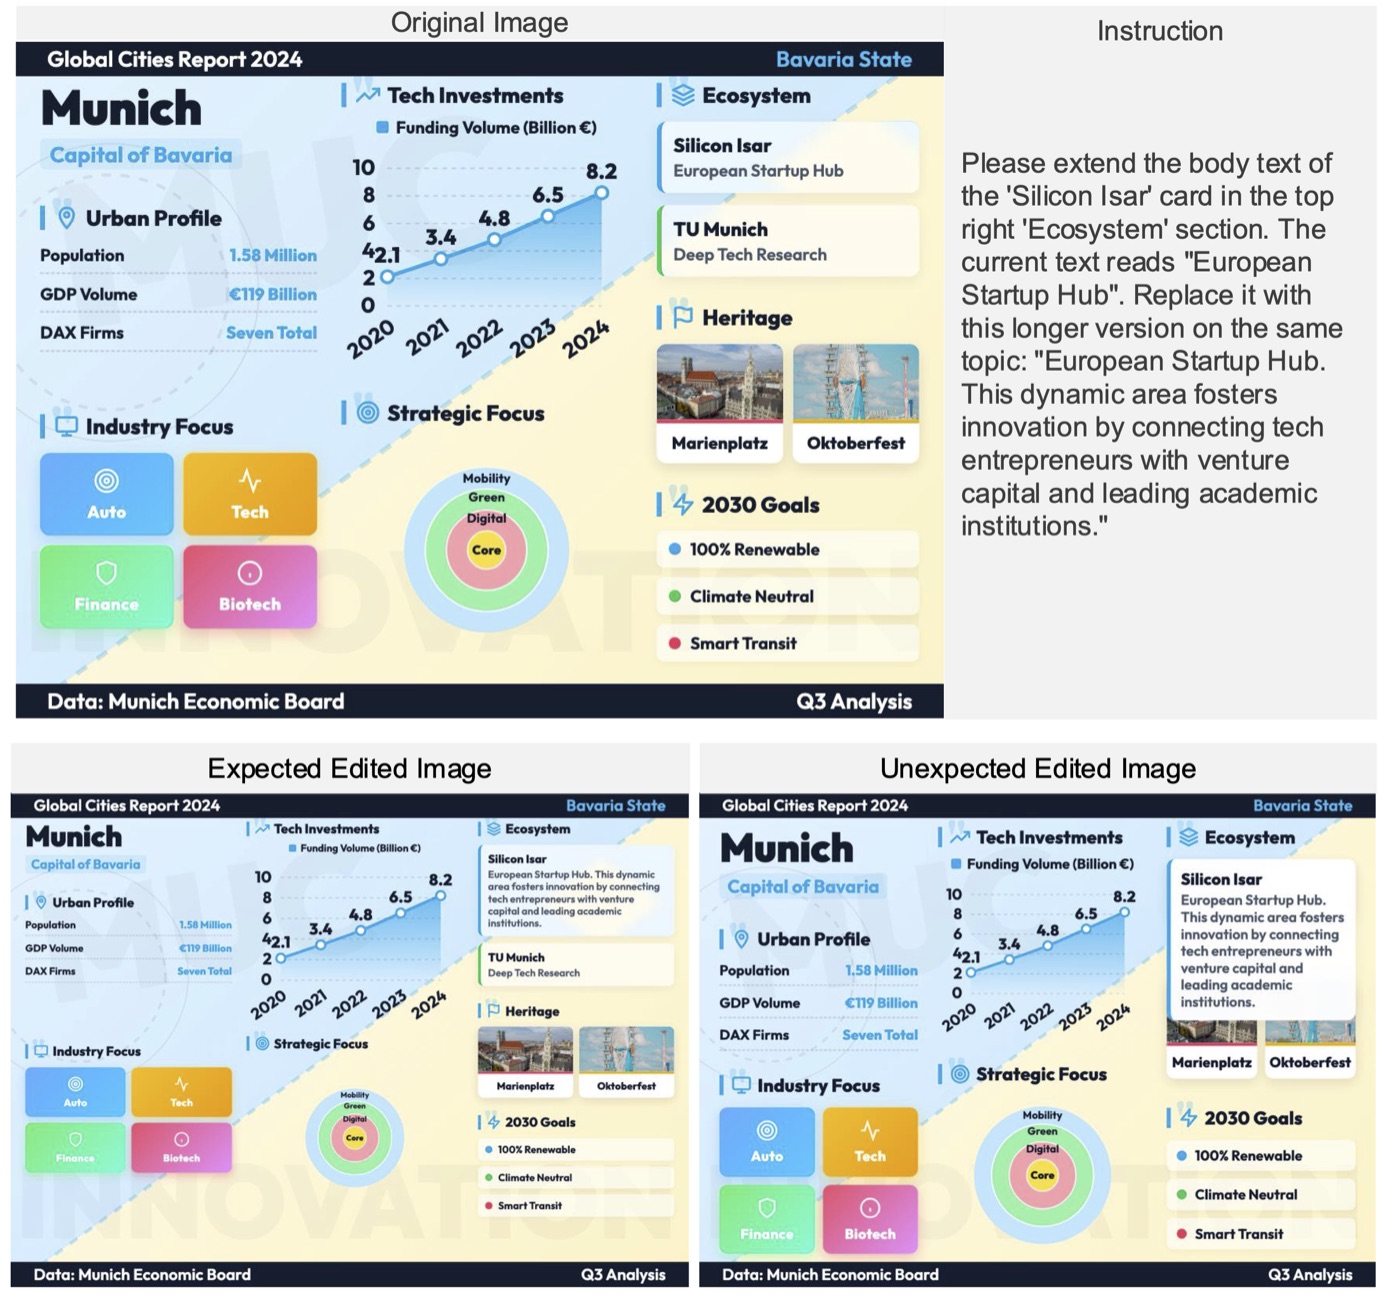
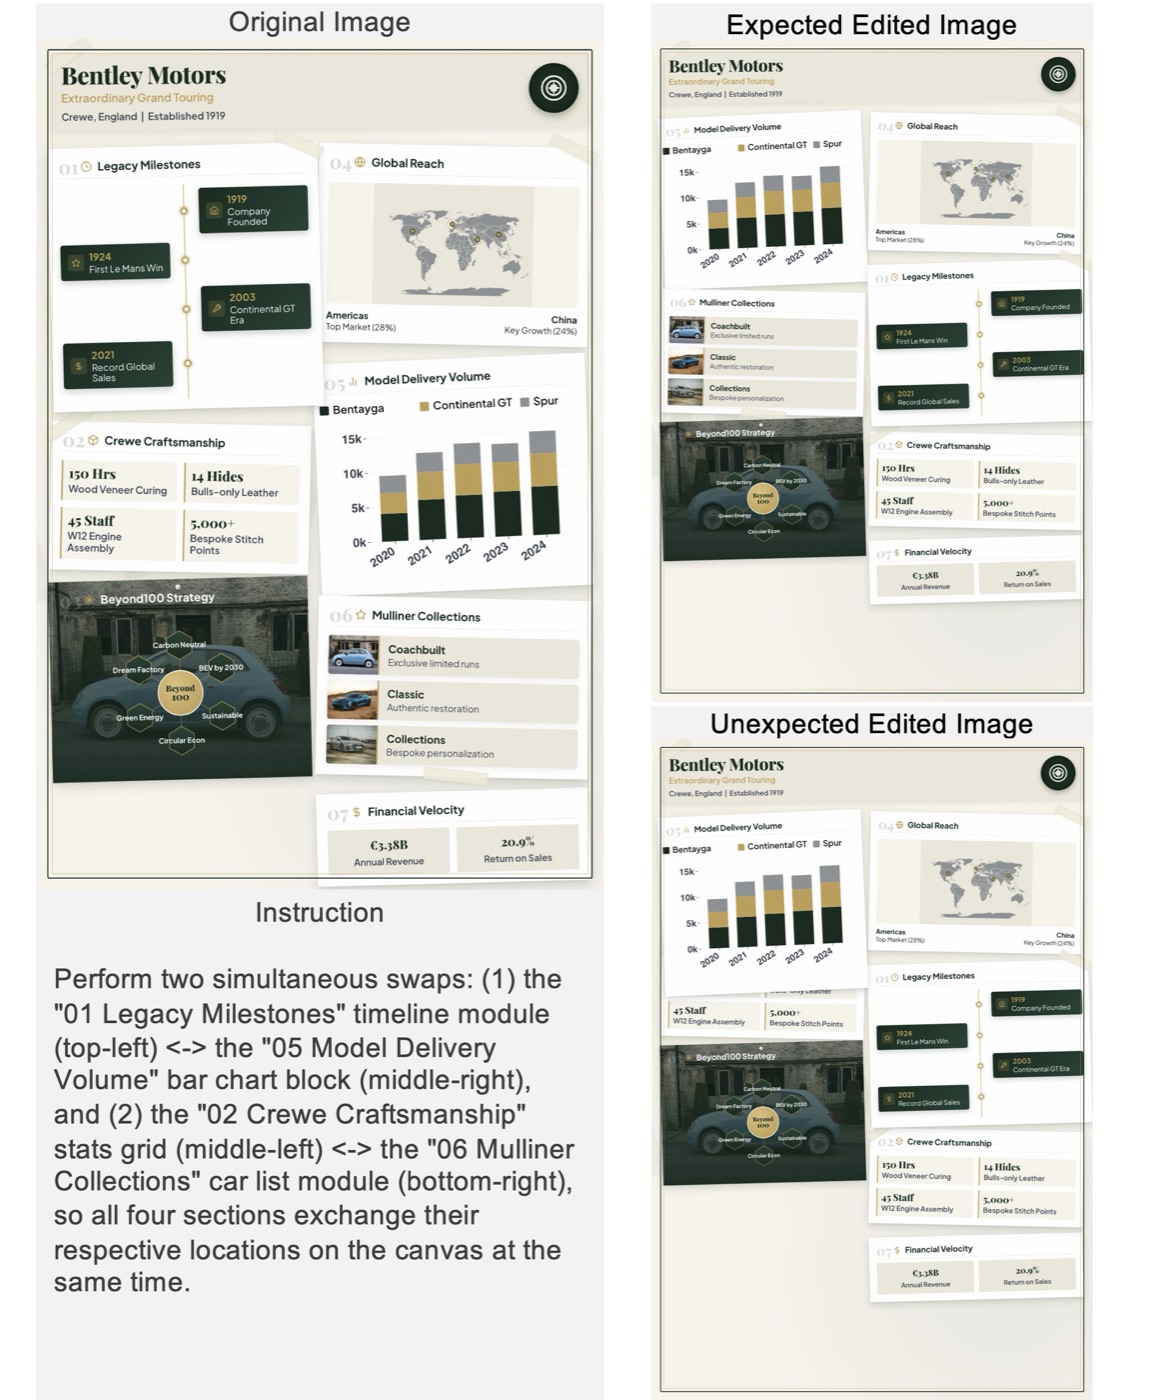
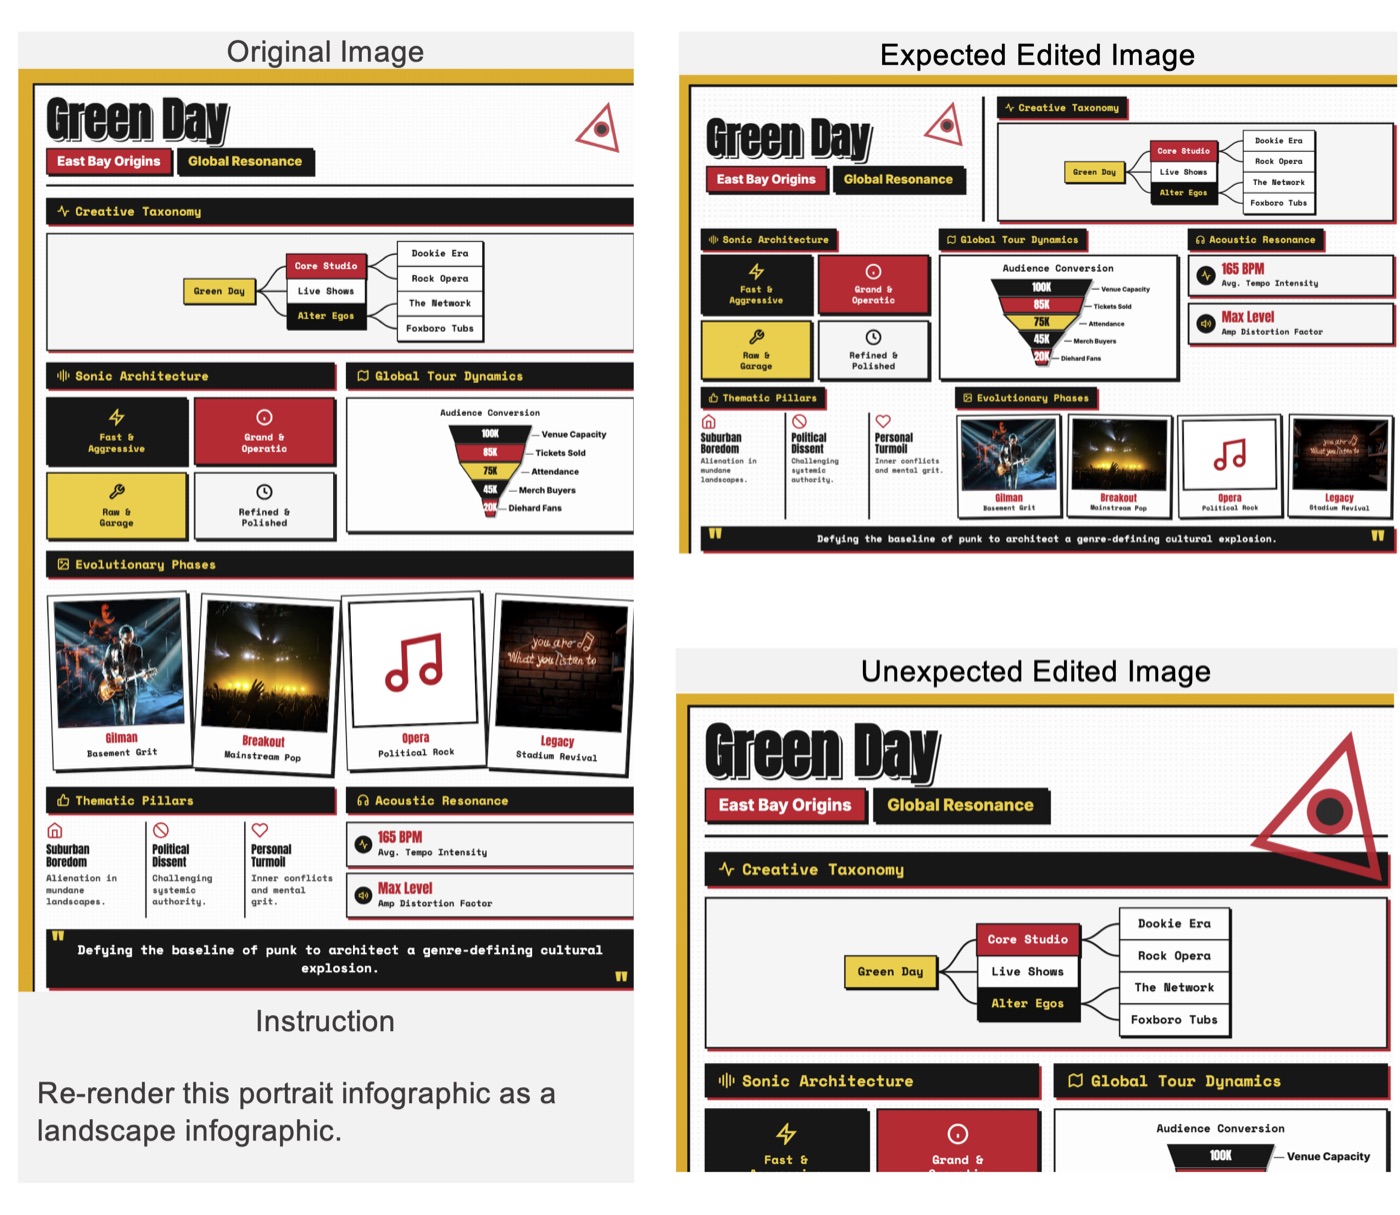
Reflow-aware judging
For each (X, I, X′) triple we prompt an MLLM with the original image, the edited image and the instruction, using a task-specific rubric that reflects the edit's reflow contract. The judge returns a JSON verdict with binary edit compliance and content preservation fields, plus an overall verdict equal to their conjunction.
Eight frontier image editors
All models are queried with the 4,000 (infographic, instruction) pairs under each model's recommended inference settings, and every triple is judged by Gemini-3.1-Pro. EC = edit compliance, CP = content preservation, SR = success rate (their conjunction). All values are percentages; Avg. is the mean SR across tasks.
| Model | Expand-Text | Insert-Element | Swap-Block | Reshape-Canvas | Avg. | ||||||||
|---|---|---|---|---|---|---|---|---|---|---|---|---|---|
| EC | CP | SR | EC | CP | SR | EC | CP | SR | EC | CP | SR | ||
| Proprietary | |||||||||||||
| GPT-Image-2 | 99.0 | 86.7 | 85.9 | 85.4 | 80.7 | 72.0 | 29.0 | 79.2 | 25.5 | 96.3 | 65.1 | 64.4 | 62.0 |
| Nanobanana-Pro | 87.1 | 64.0 | 57.8 | 58.8 | 57.8 | 40.2 | 36.5 | 79.8 | 32.0 | 87.2 | 36.9 | 36.4 | 41.6 |
| Nanobanana-2 | 85.1 | 58.6 | 52.6 | 65.3 | 49.4 | 39.0 | 30.0 | 72.1 | 24.0 | 92.0 | 36.4 | 36.3 | 38.0 |
| Nanobanana | 23.2 | 23.8 | 9.2 | 3.1 | 14.6 | 0.4 | 1.6 | 41.8 | 0.9 | 25.4 | 8.4 | 3.5 | 3.5 |
| Seedream-5.0-Lite | 22.1 | 28.0 | 9.1 | 12.3 | 11.0 | 1.3 | 9.3 | 37.0 | 5.2 | 64.1 | 4.6 | 4.3 | 5.0 |
| Open-Weight | |||||||||||||
| HunyuanImage-3.0 | 21.3 | 34.8 | 12.6 | 2.5 | 4.3 | 0.0 | 0.4 | 16.4 | 0.0 | 1.4 | 5.2 | 0.0 | 3.2 |
| Qwen-Image-Edit | 9.2 | 3.3 | 1.5 | 1.2 | 2.7 | 0.0 | 0.0 | 6.3 | 0.0 | 16.5 | 0.0 | 0.0 | 0.4 |
| FLUX.2-klein-base-9B | 6.1 | 7.2 | 0.0 | 0.0 | 21.2 | 0.0 | 0.0 | 77.8 | 0.0 | 20.3 | 0.0 | 0.0 | 0.0 |
Editing performance of eight image-editing models on InfoEdit. A clear capability gap separates the frontier proprietary models from the rest: only GPT-Image-2 clears 60% average SR, and all three open-weight models score 0% SR on Insert-Element, Swap-Block and Reshape-Canvas. High CP alone does not imply success — FLUX.2-klein-base-9B reaches 77.8% CP on Swap-Block with 0.0% EC, because the requested structural edit is never completed.
Editing the source instead of the pixels
Because every InfoEdit infographic ships with HTML or PowerPoint source, we can run code-level editing under the same protocol. Code feeds the model the source alone; Code + Image adds the rendered original as visual grounding. Gemini, GPT and Kimi models serve as code generators, and their edited outputs are rendered back into images.
| Model | Expand-Text | Insert-Element | Swap-Block | Reshape-Canvas | Avg. | ||||||||
|---|---|---|---|---|---|---|---|---|---|---|---|---|---|
| EC | CP | SR | EC | CP | SR | EC | CP | SR | EC | CP | SR | ||
| Code | |||||||||||||
| Kimi-K3 | 89.4 | 81.5 | 74.7 | 86.9 | 77.2 | 72.3 | 66.8 | 84.2 | 60.6 | 77.8 | 52.7 | 52.6 | 65.1 |
| GPT-5.6-Sol | 87.1 | 80.8 | 73.8 | 86.8 | 74.5 | 69.2 | 66.1 | 81.2 | 56.7 | 83.7 | 56.3 | 55.6 | 63.8 |
| Gemini-3.1-Pro | 85.7 | 72.3 | 67.4 | 85.6 | 70.7 | 68.0 | 68.8 | 77.6 | 59.6 | 69.4 | 45.2 | 45.1 | 60.0 |
| Gemini-3.5-Flash | 83.3 | 68.1 | 64.1 | 84.1 | 64.5 | 62.0 | 60.1 | 79.2 | 54.8 | 70.4 | 42.4 | 42.2 | 55.8 |
| Gemini-3.1-Flash | 79.6 | 65.5 | 60.6 | 63.4 | 49.1 | 40.2 | 56.1 | 72.7 | 47.1 | 38.0 | 5.3 | 5.2 | 38.3 |
| Code + Image | |||||||||||||
| Kimi-K3 | 91.6 | 82.5 | 79.1 | 90.2 | 82.4 | 77.2 | 69.4 | 83.2 | 62.8 | 76.5 | 53.2 | 52.5 | 67.9 |
| GPT-5.6-Sol | 89.1 | 79.6 | 74.8 | 91.8 | 77.8 | 74.7 | 67.2 | 83.9 | 60.8 | 82.7 | 58.4 | 58.3 | 67.2 |
| Gemini-3.1-Pro | 88.2 | 72.0 | 68.5 | 85.3 | 72.2 | 71.0 | 69.0 | 78.4 | 60.2 | 71.8 | 47.2 | 46.8 | 61.6 |
| Gemini-3.5-Flash | 85.1 | 69.5 | 65.8 | 85.4 | 67.2 | 63.2 | 60.9 | 79.8 | 56.8 | 71.2 | 46.6 | 43.1 | 57.2 |
| Gemini-3.1-Flash | 80.2 | 64.5 | 59.6 | 64.3 | 51.4 | 43.0 | 56.4 | 74.0 | 50.2 | 38.1 | 8.7 | 8.6 | 40.4 |
| Pixel-level reference | |||||||||||||
| GPT-Image-2 | 99.0 | 86.7 | 85.9 | 85.4 | 80.7 | 72.0 | 29.0 | 79.2 | 25.5 | 96.3 | 65.1 | 64.4 | 62.0 |
Code-level editing on InfoEdit. Kimi-K3 with Code + Image reaches 67.9% average SR, surpassing GPT-Image-2's 62.0% — but the task-level pattern is not uniform. GPT-Image-2 stays stronger on Expand-Text and Reshape-Canvas, while Kimi-K3 is stronger on Insert-Element and much stronger on Swap-Block (EC 29.0 → 69.4, SR 25.5 → 62.8), because source code makes named blocks directly addressable.
Where and why editors fail
Difficulty scales as designed
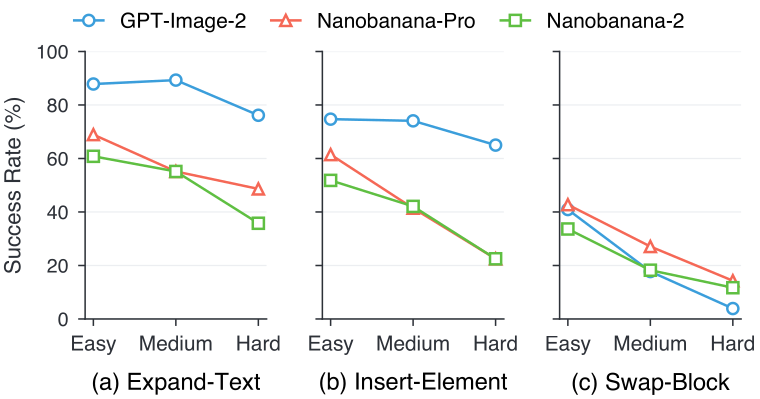
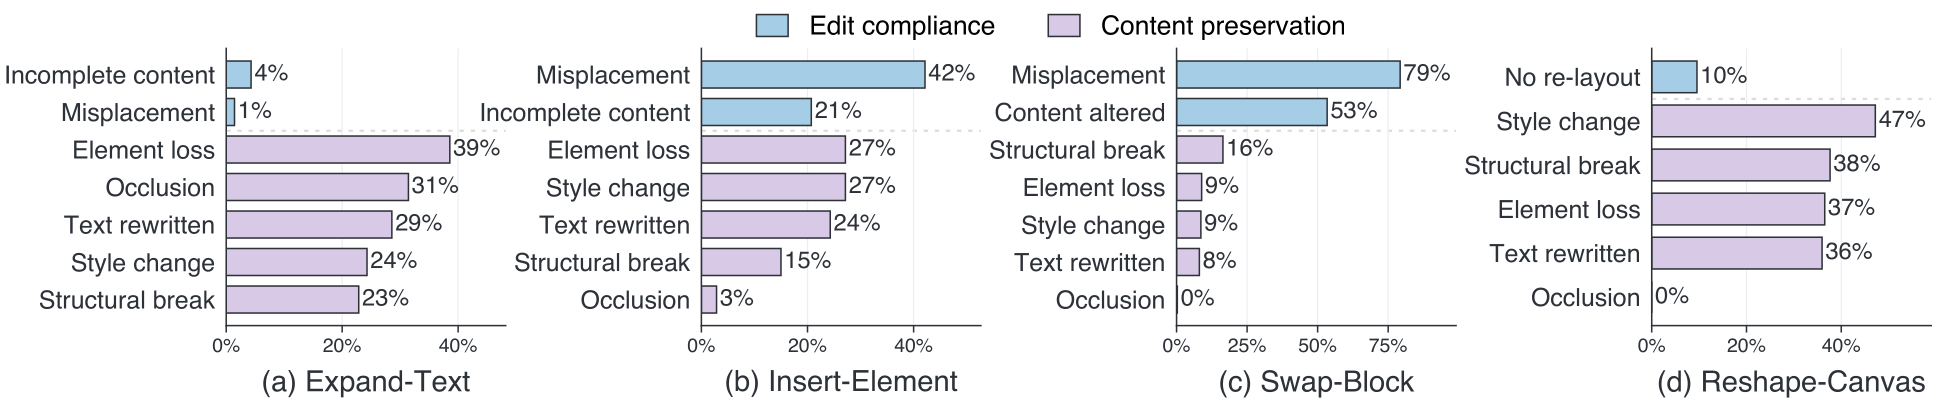
Where the failures concentrate
Is localization the bottleneck? No.
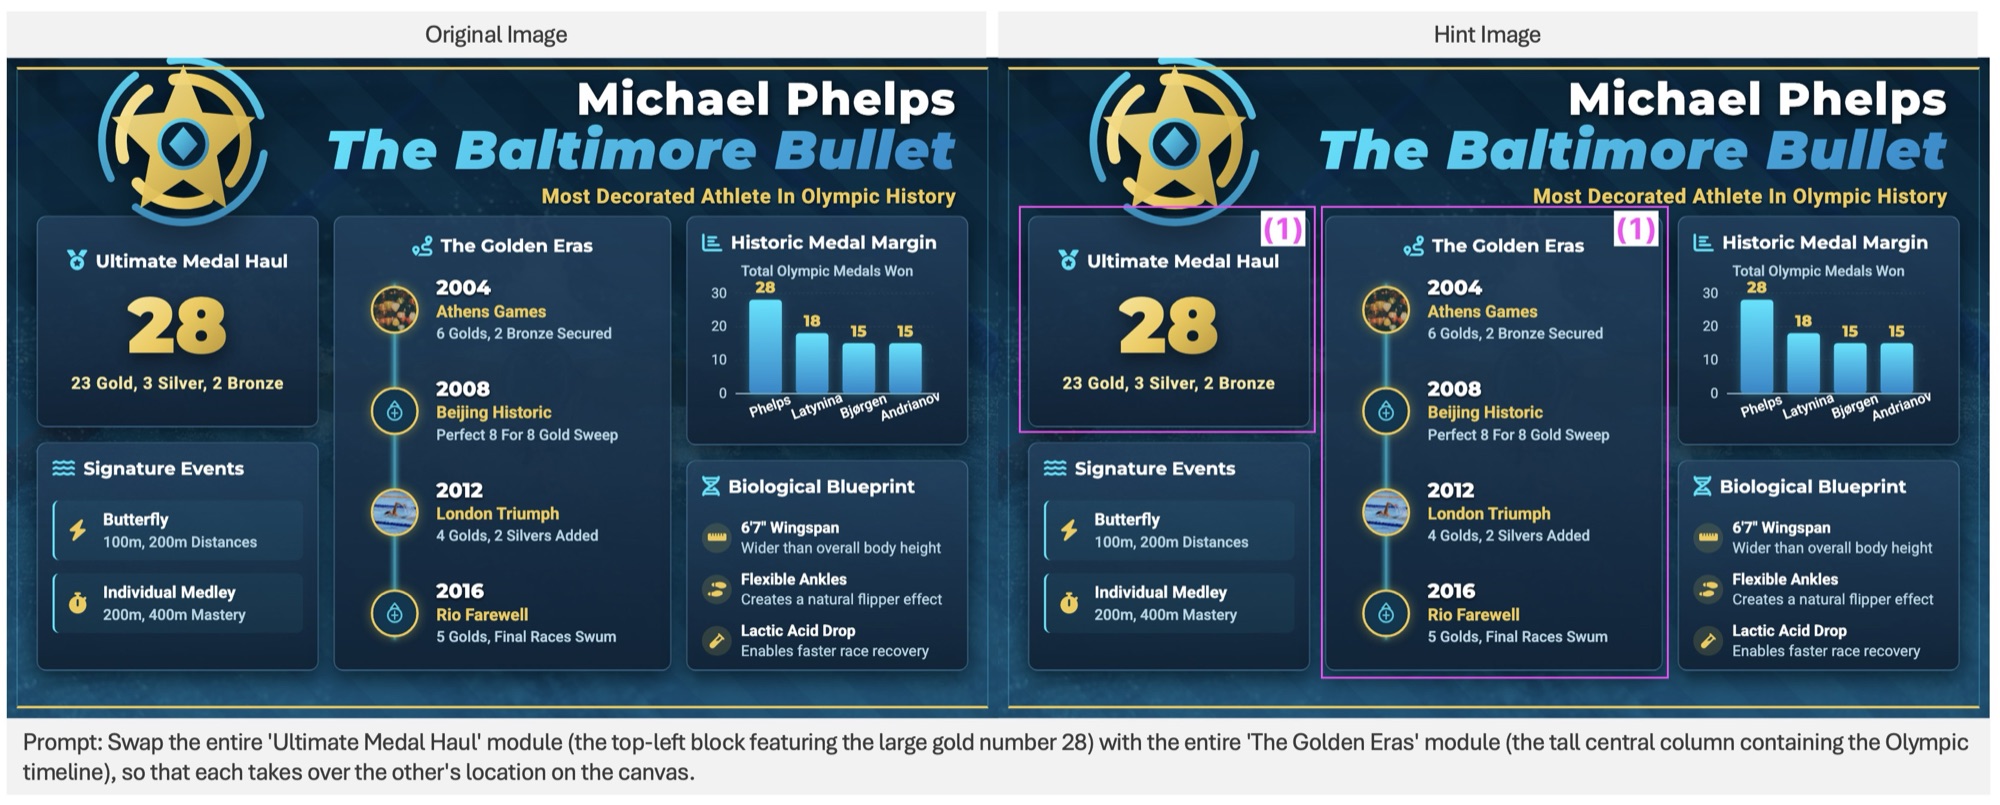
Swap-Block failures could stem from two causes: the model cannot execute the structural verb, or it cannot resolve which two blocks the instruction names. To separate them, we annotate the input image with interactive selection hints — each swap pair marked with a bounding box and a matching numeric label — and tell the model the marks are localization guidance that must not appear in the output.
| Model | Hint | EC | CP | SR | ΔSR |
|---|---|---|---|---|---|
| GPT-Image-2 | w/o | 29.0 | 79.2 | 25.5 | — |
| w/ | 34.2 | 92.7 | 34.9 | +9.4 | |
| Nanobanana-Pro | w/o | 36.5 | 79.8 | 32.0 | — |
| w/ | 39.4 | 83.6 | 35.2 | +3.2 | |
| Nanobanana-2 | w/o | 30.0 | 72.1 | 24.0 | — |
| w/ | 34.2 | 79.1 | 27.5 | +3.5 |
Effect of interactive selection hints on Swap-Block. The gain is consistently modest (+3.2 to +9.4 SR), and even with perfect localization no model exceeds 35% SR. The bottleneck is the reflow operation itself, not target localization.
What InfoEdit reveals
A capability cliff, not a gradient
Only GPT-Image-2 clears 60% average SR (62.0%); Nanobanana-Pro and Nanobanana-2 reach 41.6% and 38.0%; the remaining five models fall at or below 7%. Many models fail to produce usable infographics at all.
Swap-Block is essentially unsolved
No editor exceeds 32.0% SR on Swap-Block, and marking the swap targets with bounding boxes lifts SR by only +3.2 to +9.4 points: the bottleneck is reflow, not grounding.
Correct edits that silently break the layout
On Reshape-Canvas the top three models achieve 87–96% EC but only 36–65% CP. On Expand-Text, EC failures are ≤ 4% while most errors are preservation failures. Grading a single overall verdict would hide this entirely.
Code-level editing is a complementary pathway
Kimi-K3 over source code plus the rendered image reaches 67.9% average SR, surpassing GPT-Image-2's 62.0% — and more than doubles Swap-Block SR (25.5 → 62.8). The two pathways have different strengths, pointing toward hybrid systems.
BibTeX
If you find InfoEdit useful in your research, please consider citing:
@article{yang2026infoedit,
  title   = {InfoEdit: Probing Global Layout Reasoning in Infographic Editing},
  author  = {Yang, Cheng and Shi, Chufan and Wang, Huijuan and Shui, Bo and
             Wu, Yaokang and Tao, Muzi and Yan, Yibo and Ma, Xuezhe and
             Berg-Kirkpatrick, Taylor},
  journal = {arXiv preprint arXiv:2609.33286},
  year    = {2026}
}